- Tweet
- Printer Friendly
On-Farm Evaluation Trial of Fertilizer Timing and Rate on Cool-Season Forage Varieties
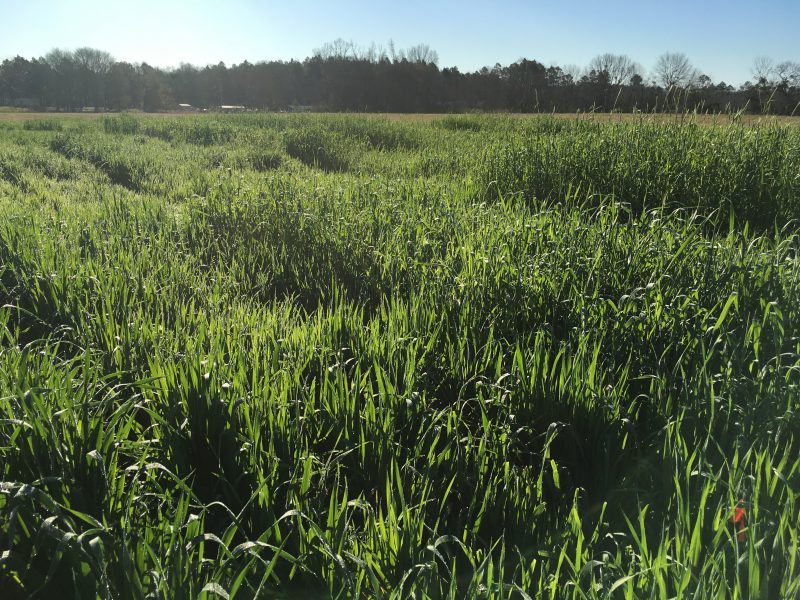
A cool-season forage fertility trial was conducted in Holmes County in the winter of 2019-20 and 2020-21 to evaluate common fertilizer practices and determine the impact on yields. Credit: Kalyn Waters, UF/IFAS Extension
Cool-season forages are widely used in the Florida Panhandle as a supplement for cattle during the fall and winter months. These forages are typically planted from October to December, depending on location and weather, and provide grazable forage from January through April. A two-year on farm trial was conducted at Williams Farm, near Graceville, FL.
–
Objectives
The objectives of this trial were to 1) evaluate common on-farm fertilizer practices and their impact on the performance of cool-season forages and 2) determine if fertilizer rates impacted various cool-season forage varieties. Treatments were similar to common practices from cattle producers in Holmes County. Planting dates, treatments, and fertilizer applications were done according to weather and managed on-farm. Variation in planting dates and fertilizer application dates were a result of on-farm management decisions. The goal was to manage the plots as if they were being managed for cattle grazing, not for a research trial.
–
Treatments and Varieties
A total of four treatments were applied across cool-season forage varieties. The treatments were as follows:–
- Full 80 – Application of 80 units of nitrogen between 40- and 60-days post planting
- Full 60 – Application of 60 units of nitrogen between 40- and 60-days post planting
- Split 60 – Application of a total of 60 units of nitrogen with 40 units applied 40- and 60-days post planting and another 20 units applied 30 days following first application.
- Full 60 (3x) – Application of 60 units of nitrogen, phosphorus, and potassium between 40- and 60-days post planting
The following cool-season forages varieties were planted in both years at recommended rates per forage type and variety:
- Oats: Coker 227 and Legend 567 (Buck Tale or FL 0567)
- Rye: Kelley Grazer III (FL 104) and Wrens Abruzzi
- Triticale: TriCal 342
- Ryegrass: Gulf, Prine and Attain
Sampling and Analysis
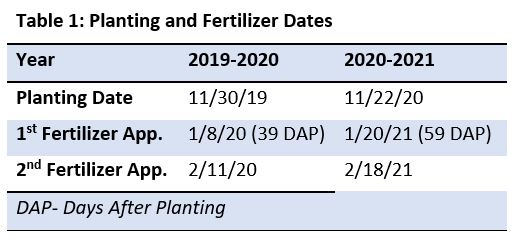
Treatments were randomly applied to selected varieties of Oats, Rye, Triticale, and Ryegrass. The trial was then duplicated over a two-year period (Yr1 2019-2020 and Yr 2- 2020-2021). Fertilizer was applied across varieties on average 49 days after planting (Table 1 above), if treatment required a second application of fertilizer, it was applied 30 days following the first fertilizer application.
On average, 80 days after planting (Yr 1= 73 days, Yr 2= 86 days) each variety was sampled to determine total yield. Samples were taken from a two-foot square area and converted to acres to determine total forage yield per acre. Forage was sampled four times, every other week for six weeks following the initial sample date. The samples were taken in the same area for each collection to mimic grazing and measure regrowth. Samples were collected and dried to determine total dry-matter yield per acre by treatment for each variety.
–
Results
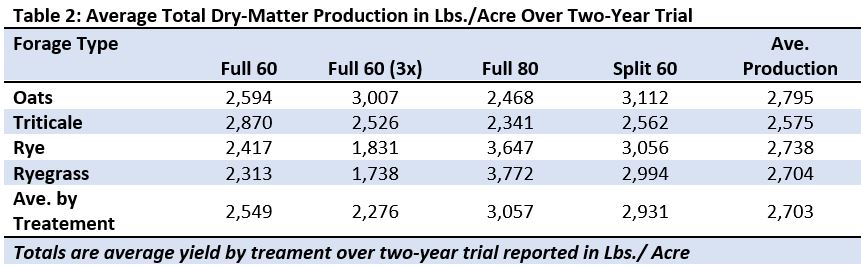
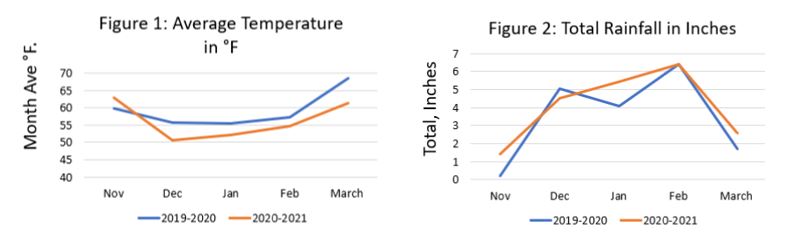
Figure 1 and Figure 2 summarize the weather data for the growing years. The data is a monthly average temperature and total monthly rainfall. Total rainfall in 2019-2020 was 17.41 inches and in 2020-2021 was 20.42 inches. The average temperature over the entire growing season in 2019-2020 was 59°F and in 2020-2021 was 56°F. Total dry-matter yield was determined by forage type across treatments. Due to limited trial capacity, yields across varieties were not representative of typical varietal difference, but visual differences were noted for variety performance. Typically, there is minimal difference across top varieties in years without drought and disease issues.
The average total dry-matter production per acre over the two-year trial for each forage type can be seen in Table 2. Overall forage yield totals by forage type rank: 1) Oats, 2) Triticale, 3) Rye, and 4) Ryegrass. Overall forage yields by treatment ranked 1) Full 80, 2) Split 60, 3) Full 60, and 4) Full 60(3x).
–
=
Figure 3 shows the average dry-matter yield by forage type in response to timing and rate of fertilizer applications (treatments). Overall, the highest total yields for the selected forage varieties were as follows in Figure 3:
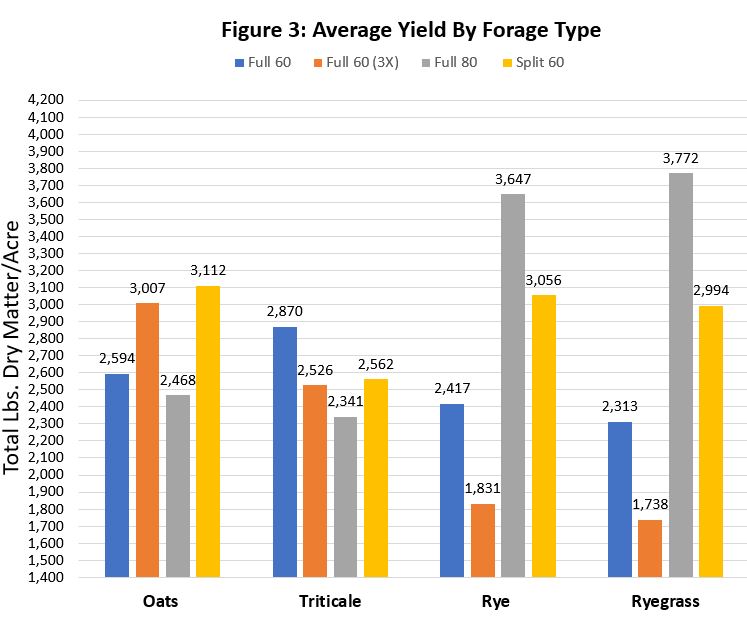 Yield Rankings by variety for each fertilizer treatment
- Forage Oats – 1) Split 60, 2) Full 60 (3X), 3) Full 60, and 4) Full 80
- Triticale – 1) Full 60, 2) Split 60, 3) Full 60 (3X), and 4) Full 80
- Rye – 1) Full 80, 2) Split 60, 3) Full 60, and 4) Full 60 (3x)
- Ryegrass – 1) Full 80, 2) Split 60, 3) Full 60, and 4) Full 60 (3x)
=
Conclusion
Years of research has established how cool-season forages respond to fertilizer treatments. This study is a snapshot in time and provides information on how different fertilizer rates and timing can impact forage yield. Take home messages are as follows:
- Forage Oats are sensitive to soil fertility and timing of fertilizer. By applying N-P-K to improve soil quality and by including a second application of nitrogen, an increase in yield was observed.
- A minimal difference was seen across treatments for Triticale.
- Forage Rye and Ryegrass are not as impacted by soil fertility as Oats.
- Both the Rye and Ryegrass responded in a similar trend with an application of 80 units of nitrogen producing the highest yields.
- A second application of nitrogen for later maturing cool-season forages like Ryegrass will increase your overall yield.
- –
- This field-trial was a collaboration between Dr. Jose Dubeux, UF/IFAS Extension Forage Specialist, Dr. Ann Blount, UF/IFAS Extension Forage Specialist, Kalyn Waters, UF/IFAS Extension Holmes County Director and Williams Farms.
- Source: IFAS Extension